Physics 9th: Motion | Graphical Representation of Motion
Graphical Representation of Motion
A Graph represents the relation between two variable quantities in pictorial form. A graph is plotted between two variable quantities.
The quantity that is made to alter at will is called independent variable. The other quantity, which varies as a result of this change is called the dependent variable.
These graphs are used to calculate speed, acceleration and distance.
For the purpose of graphical representation speed and velocity are taken in the same meaning.
There are two types of graphs we draw
1. Distance –Time graph
2. Speed – Time graph or Velocity-Time graph
DISTANCE –TIME GRAPH
(a) When we draw Distance –Time Graphs, time is always taken on the x-axis and distance on the y-axis.
In this graph AB is a straight line parallel to x-axis. In this graph, the distance travelled is not increasing with time. This is a graph of stationary object.

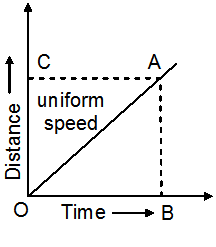
(b) The Distance-Time graph of a body moving at uniform speed is represented by a straight line OA as shown in figure. It can be used to calculate the speed of the body by finding the slope of the graph
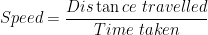


(c) When the Speed – Time graph is a curve, it represents non-uniform motion. This curved line is called a PARABOLA
SPEED-TIME GRAPH
When speed remains constant (zero Acceleration)
If the speed-time graph of a body is a straight line parallel to the time axis, then speed of the body is constant (uniform)

= YZ ´ OZ
Therefore, the area enclosed by the speed-time graph and the x-axis(time-axis), represents the Distance travelled by the body.

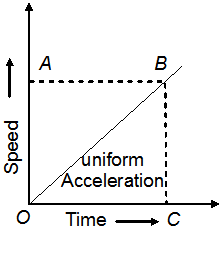
When speed increases at uniform rate (uniform Acceleration)
The speed –time graph for uniformly changing speed will be a straight line.
Acceleration
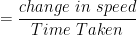
Acceleration

Therefore acceleration of a body is given by the slope of the graph

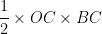
The distance travelled = Area under DOBC =
When speed decreases at uniform rate(Retardation)
In speed time graphs, a straight line sloping downwards indicates uniform retardation.

When initial speed of the body is not zero
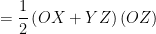
When the initial speed of the body is not zero, the speed-time graph is represented as a straight line forming a trapezium with the time-axis.
Distance travelled = Area of Trapezium OXYZ
= 


When speed changes at non-uniform rate
Speed-time graph of non-uniform speed (non-uniform acceleration) is a curved line.
